How to generate a graph from docker-compose.yml


Imagine you to have a very big docker-compose.yml file with a lot of services and dependencies.
You've too multiple exposed ports.
You'd like to have an at-a-glance view of services, dependencies and open ports. Is this possible? Yes! https://github.com/compose-viz/compose-viz do the magic for us.
For the demo, please start a Linux shell and run mkdir -p /tmp/compose-viz && cd $_ to create a folder called compose-viz in your Linux temporary folder and jump in it.
Please create a new file called docker-compose.yml with this simplified content:
services:
  joomla:
    image: joomla
    ports:
      - 8080:80
    depends_on:
      - joomladb

  joomladb:
    image: postgres:16.0-alpine
Let the magic happen and run docker run --rm -it -v $(pwd):/in wst24365888/compose-viz docker-compose.yml.
And the image here below will be generated by the tool:

We can see that the port 8080 is exposed to the computer. That port is, in fact, port 80 of the joomla container. And, too, we see that joomla has a dependency with the joomladb container. Easy no?
By adding -m svg, you'll get a SVG insteand of a PNG. The list of supported output formats is huge: png|dot|jpeg|json|svg|bmp|canon|cmap|cmapx|cmapx_np|dot_json|emf|emfplus|eps|fig|gif|gv|imap|imap_np|ismap|jpe|jpg|json0|metafile|mp|pdf|pic|plain|plain-ext|pov|ps|ps2|tif|tiff|tk|vml|xdot|xdot1.2|xdot1.4|xdot_json.
Much complex example
Replace the content of the docker-compose.yml with this one:
services:

  redis:
    image: redis:alpine
    ports:
      - "6379"
    networks:
      - frontend
    deploy:
      replicas: 2
      update_config:
        parallelism: 2
        delay: 10s
      restart_policy:
        condition: on-failure

  db:
    image: postgres:9.4
    volumes:
      - db-data:/var/lib/postgresql/data
    networks:
      - backend
    deploy:
      placement:
        constraints: [ node.role == manager ]
  vote:
    image: dockersamples/examplevotingapp_vote:before
    ports:
      - 5000:80
    networks:
      - frontend
    depends_on:
      - redis
    deploy:
      replicas: 2
      update_config:
        parallelism: 2
      restart_policy:
        condition: on-failure
  result:
    image: dockersamples/examplevotingapp_result:before
    ports:
      - 5001:80
    networks:
      - backend
    depends_on:
      - db
    deploy:
      replicas: 1
      update_config:
        parallelism: 2
        delay: 10s
      restart_policy:
        condition: on-failure

  worker:
    image: dockersamples/examplevotingapp_worker
    networks:
      - frontend
      - backend
    deploy:
      mode: replicated
      replicas: 1
      labels: [ APP=VOTING ]
      restart_policy:
        condition: on-failure
        delay: 10s
        max_attempts: 3
        window: 120s
      placement:
        constraints: [ node.role == manager ]

  visualizer:
    image: dockersamples/visualizer
    ports:
      - "8080:8080"
    stop_grace_period: 1m30s
    volumes:
      - /var/run/docker.sock:/var/run/docker.sock
    deploy:
      placement:
        constraints: [ node.role == manager ]

networks:
  frontend:
  backend:

volumes:
  db-data:
And the image here below will be generated by the tool:
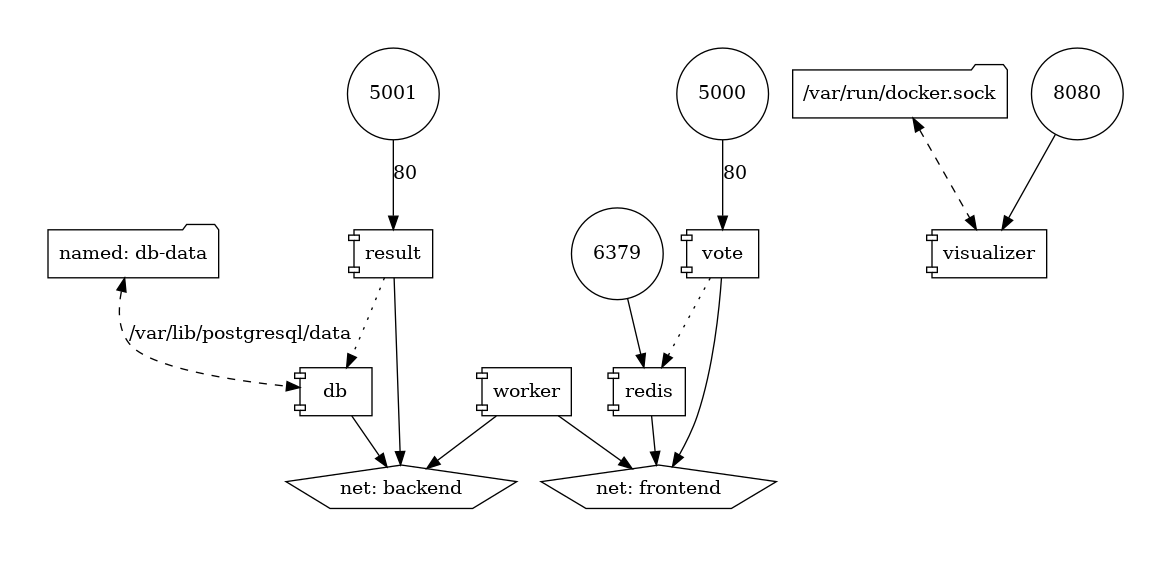
Here, we can see:
- We've four exposed ports:
5001,5000,6379and8080. - Port
8080is linked to avisualizerweb service; that service is using a volume pointing to/var/run/docker.sock - Ports
5000and5001are referring to services calledvoteandresult. Since the internal port is port80, we know that these ports are web interfaces. - The
voteservice (port5000) is using aredisservice; accessible using port6379. - The
resultservice (port5001) is linked to a Postgres service calleddband having persistent data (since we have a Docker volume calleddb-data). - And so on.
Such a visualization tool greatly simplifies the understanding of a Docker architecture.
Docker config
If like me you're using a lot of .yml files by running Docker and/or using environment variables in it; just run docker compose config to ask Docker to render (on the screen only) what he called Parse, resolve and render compose file in canonical format i.e. will merge all your .yml in one string and resolve variables.
Copy/paste the screen output in a temporary file and use this tool on that file.